Save Search
Save Search
 $101,00010 Nuttall Ln, Worcester MA 01604Neighborhood: SunderlandPrice Per Sq. Ft.
- Listing price divided by square footage of the property.
- This is an important metric to compare properties, as location, size, and state of the property may affect the property’s price per square foot.
$140Estimated Rent
- The amount the property is estimated it can be rented for, per month.
- Default market rent is determined by the average rent over the last 12 months of a property in the same neighborhood with the same number of bedrooms and bathrooms.
- Under the Historic Rentals tab, you may view historic comparable rentals that will help give a better idea of how much similar properties have rented for.
Cap Rate
- Estimated rate of return for the property, excluding loan costs.
- Based on year 1 estimate.
- Cap rate=Net Operating Income/Purchase price
2.5%Historic Growth
- The total percentage growth in sales price of all properties in a neighborhood.
 721 Sq. Ft
 1
1 1
1 1
1
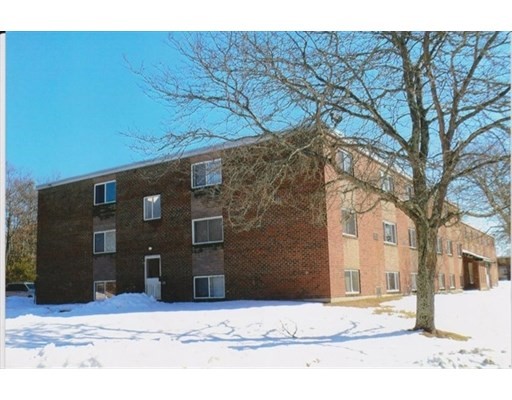 $104,9002110 Phillips Rd, New Bedford MA 02745Neighborhood: Far NorthPrice Per Sq. Ft.
- Listing price divided by square footage of the property.
- This is an important metric to compare properties, as location, size, and state of the property may affect the property’s price per square foot.
$167Estimated Rent
- The amount the property is estimated it can be rented for, per month.
- Default market rent is determined by the average rent over the last 12 months of a property in the same neighborhood with the same number of bedrooms and bathrooms.
- Under the Historic Rentals tab, you may view historic comparable rentals that will help give a better idea of how much similar properties have rented for.
Cap Rate
- Estimated rate of return for the property, excluding loan costs.
- Based on year 1 estimate.
- Cap rate=Net Operating Income/Purchase price
2.5%Historic Growth
- The total percentage growth in sales price of all properties in a neighborhood.
 628 Sq. Ft
 1
1 1
1 1
1
 $105,000210 Nichols St, Gardner MA 01440Neighborhood: N/ACap Rate
- Estimated rate of return for the property, excluding loan costs.
- Based on year 1 estimate.
- Cap rate=Net Operating Income/Purchase price
2.5%Price Per Unit
- Listing price divided by number of units.
- This is an important metric to compare properties, as location, size, number of bedrooms/bathrooms, and state of the property may affect the property’s price per unit.
$35,000Estimated NOI
- The amount the property is estimated it can be rented for, per month. Default market rent is determined by the average rent over the last 12 months of a property in the same neighborhood with the same number of bedrooms and bathrooms.
- Under the Historic Rentals tab, you may view historic comparable rentals that will help give a better idea of how much similar properties have rented for.
Price Per Sq. Ft.
- Listing price divided by square footage of the property.
- This is an important metric to compare properties, as location, size, and state of the property may affect the property’s price per square foot.
$39 2,689 Sq. Ft
 3
3 8
8 3
3
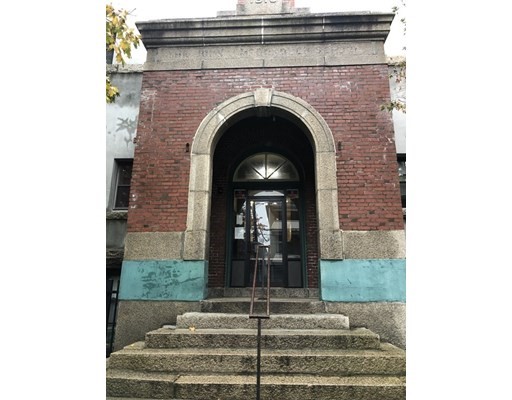 $108,900260 Fountain Street, Fall River MA 02721Neighborhood: Globe VillagePrice Per Sq. Ft.
- Listing price divided by square footage of the property.
- This is an important metric to compare properties, as location, size, and state of the property may affect the property’s price per square foot.
$122Estimated Rent
- The amount the property is estimated it can be rented for, per month.
- Default market rent is determined by the average rent over the last 12 months of a property in the same neighborhood with the same number of bedrooms and bathrooms.
- Under the Historic Rentals tab, you may view historic comparable rentals that will help give a better idea of how much similar properties have rented for.
Cap Rate
- Estimated rate of return for the property, excluding loan costs.
- Based on year 1 estimate.
- Cap rate=Net Operating Income/Purchase price
2.5%Historic Growth
- The total percentage growth in sales price of all properties in a neighborhood.
 889 Sq. Ft
 2
2 1
1 0
0
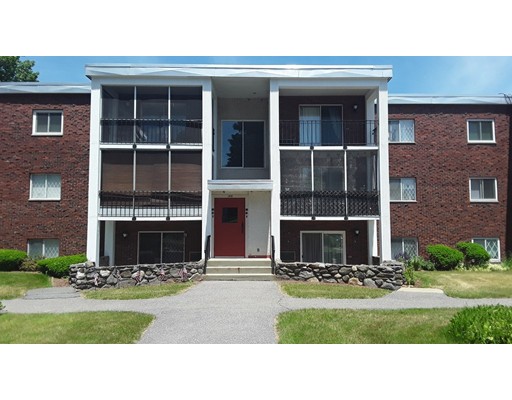 $109,000144 West Street, Leominster MA 01453Neighborhood: N/APrice Per Sq. Ft.
- Listing price divided by square footage of the property.
- This is an important metric to compare properties, as location, size, and state of the property may affect the property’s price per square foot.
$179Estimated Rent
- The amount the property is estimated it can be rented for, per month.
- Default market rent is determined by the average rent over the last 12 months of a property in the same neighborhood with the same number of bedrooms and bathrooms.
- Under the Historic Rentals tab, you may view historic comparable rentals that will help give a better idea of how much similar properties have rented for.
Cap Rate
- Estimated rate of return for the property, excluding loan costs.
- Based on year 1 estimate.
- Cap rate=Net Operating Income/Purchase price
2.5%Historic Growth
- The total percentage growth in sales price of all properties in a neighborhood.
 610 Sq. Ft
 1
1 1
1 1
1
 $109,000126 Emerald Street, Gardner MA 01440Neighborhood: N/APrice Per Sq. Ft.
- Listing price divided by square footage of the property.
- This is an important metric to compare properties, as location, size, and state of the property may affect the property’s price per square foot.
$95Estimated Rent
- The amount the property is estimated it can be rented for, per month.
- Default market rent is determined by the average rent over the last 12 months of a property in the same neighborhood with the same number of bedrooms and bathrooms.
- Under the Historic Rentals tab, you may view historic comparable rentals that will help give a better idea of how much similar properties have rented for.
Cap Rate
- Estimated rate of return for the property, excluding loan costs.
- Based on year 1 estimate.
- Cap rate=Net Operating Income/Purchase price
2.5%Historic Growth
- The total percentage growth in sales price of all properties in a neighborhood.
 1,150 Sq. Ft
 3
3 1
1 1
1
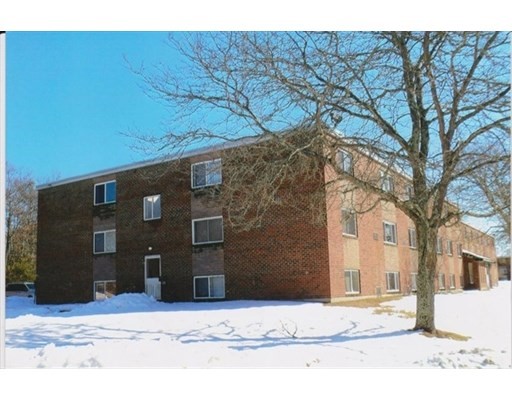 $109,9002108 Phillips Rd, New Bedford MA 02745Neighborhood: Far NorthPrice Per Sq. Ft.
- Listing price divided by square footage of the property.
- This is an important metric to compare properties, as location, size, and state of the property may affect the property’s price per square foot.
$124Estimated Rent
- The amount the property is estimated it can be rented for, per month.
- Default market rent is determined by the average rent over the last 12 months of a property in the same neighborhood with the same number of bedrooms and bathrooms.
- Under the Historic Rentals tab, you may view historic comparable rentals that will help give a better idea of how much similar properties have rented for.
Cap Rate
- Estimated rate of return for the property, excluding loan costs.
- Based on year 1 estimate.
- Cap rate=Net Operating Income/Purchase price
2.5%Historic Growth
- The total percentage growth in sales price of all properties in a neighborhood.
 887 Sq. Ft
 2
2 1
1 1
1
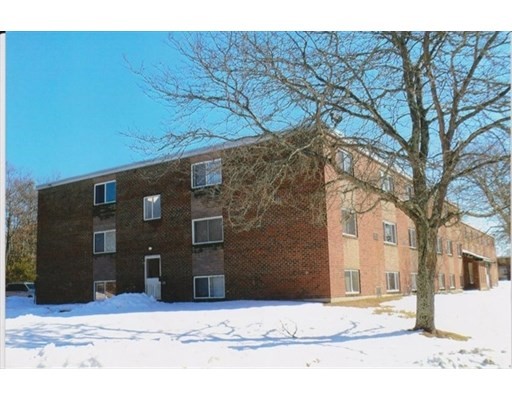 $109,9002100 Phillips Rd, New Bedford MA 02745Neighborhood: Far NorthPrice Per Sq. Ft.
- Listing price divided by square footage of the property.
- This is an important metric to compare properties, as location, size, and state of the property may affect the property’s price per square foot.
$118Estimated Rent
- The amount the property is estimated it can be rented for, per month.
- Default market rent is determined by the average rent over the last 12 months of a property in the same neighborhood with the same number of bedrooms and bathrooms.
- Under the Historic Rentals tab, you may view historic comparable rentals that will help give a better idea of how much similar properties have rented for.
Cap Rate
- Estimated rate of return for the property, excluding loan costs.
- Based on year 1 estimate.
- Cap rate=Net Operating Income/Purchase price
2.5%Historic Growth
- The total percentage growth in sales price of all properties in a neighborhood.
 931 Sq. Ft
 2
2 1
1 1
1


